This section is part of the Infineon Aurix Project 2020
Among the various possibilities offered by the Infineon Aurix TFT 297 board, the presence of a touch screen display (320×240 xga LCD) immediately outlined one of the main objectives of the project. In fact, the screen is the simplest interface to give a quick view of the available data, and the touch screen provides the possibility of receiving quick inputs for any operations on the board.

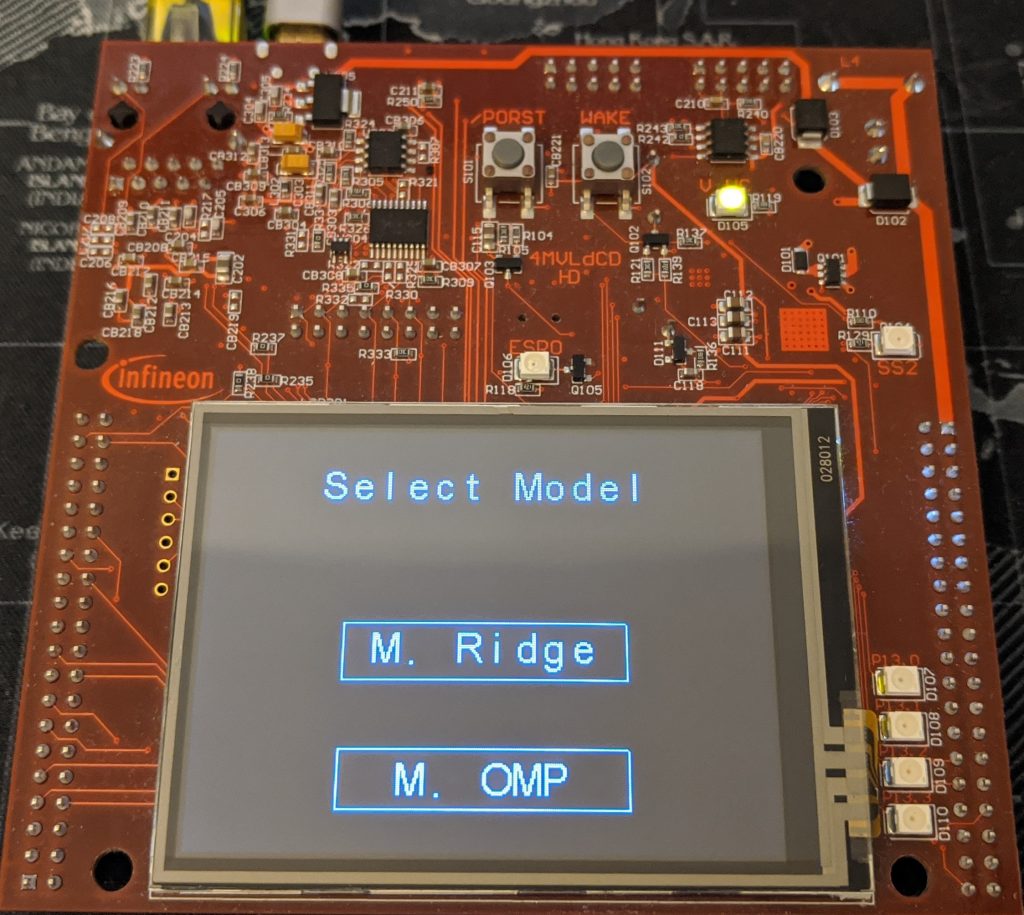
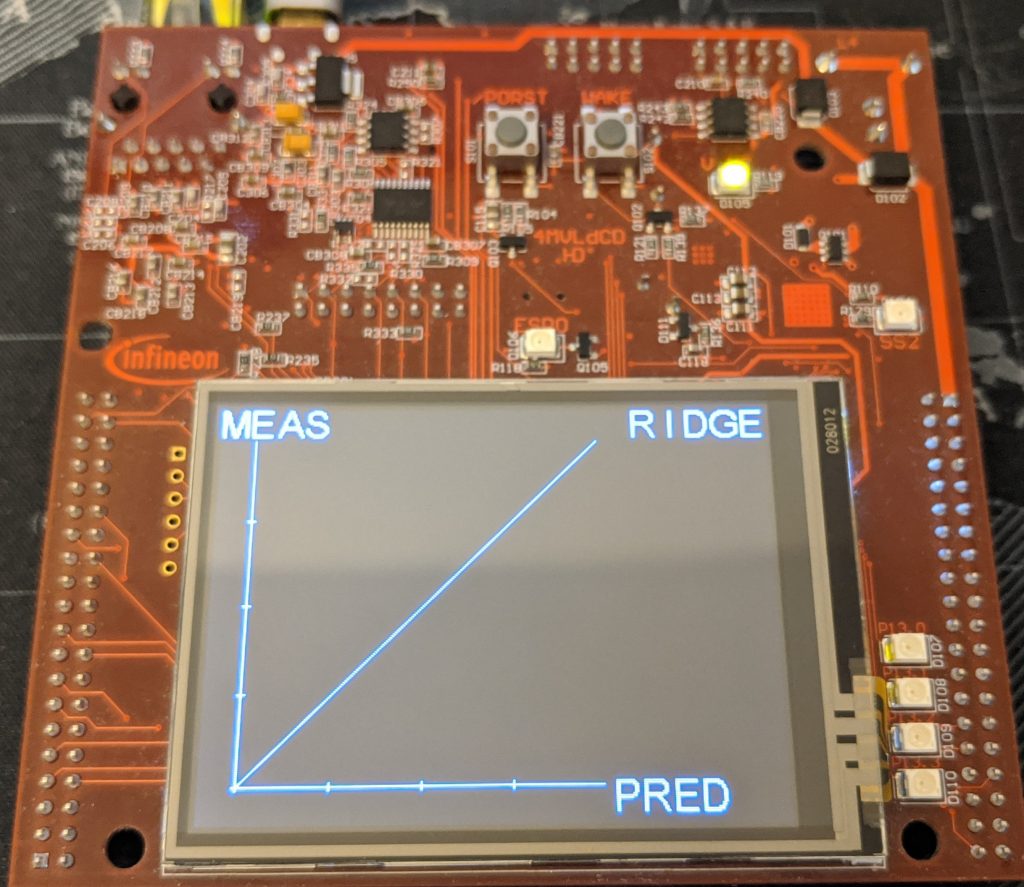
When the board starts, the initial screen is displayed, and all the implemented algorithms are shown. At this point, the board waits for an external input, via touch screen, and all the other functions are temporarily disabled. When one of the available models is selected, all the other operations are restarted, and the empty chart is displayed on the screen.

It’s useful at this point to discuss the choices made to display the data. Given the initial decision to implement algorithms for regression, it was decided to represent the data through a scatter plot. The latter provides a quick tool to understand the quality of the prediction performed. A concentration of points close to the diagonal will represent better performance.
After the initial setup, raw values are sent by the client. At this point they are processed and, as soon as the prediction result is available, a function is called to draw the point. The latter scales the values and uses a low-level function to turn on a single pixel on the screen. For each connection, a different color is assigned, in order to provide more readability.
A final analysis of the internal storing of the result was made, in order to add some functionalities to the screen. Considering 4 Byte for the predicted value and the same for the measured one, a total of 8 Byte is needed for each instance. Since the dataset used for test contains ~5000 records, a total of 40kB for each client seemed too much. For this reason, in the implementation, all values are thrown away as soon as they are displayed.