Cycle Analytics
Introduced in GitLab 8.12. Further features were added in GitLab 8.14.
Cycle Analytics measures the time spent to go from an idea to production for each of your projects. Cycle Analytics displays the median time for an idea to reach production, along with the time typically spent in each DevOps stage along the way.
Cycle Analytics is useful in order to quickly determine the velocity of a given project. It points to bottlenecks in the development process, enabling management to uncover, triage, and root-cause slowdowns in the software development life cycle.
Cycle Analytics is tightly coupled with the GitLab flow and calculates a separate median for each stage.
Overview
You can find the Cycle Analytics page under your project's Project ➔ Cycle Analytics tab.
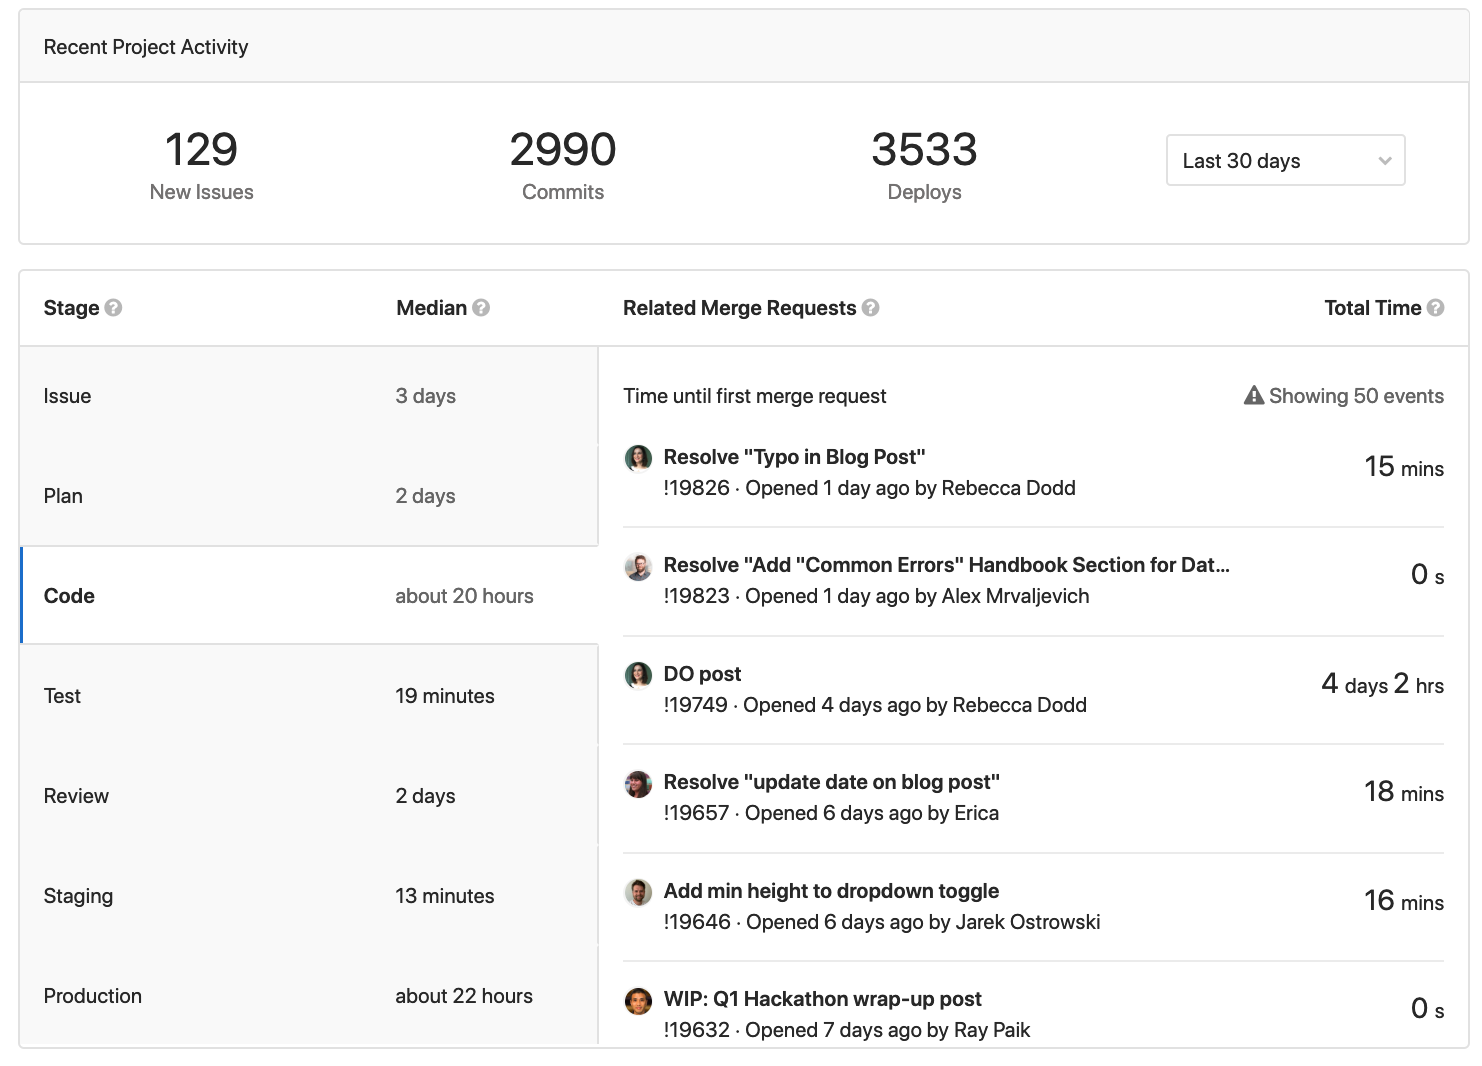
There are seven stages that are tracked as part of the Cycle Analytics calculations.
-
Issue (Tracker)
- Time to schedule an issue (by milestone or by adding it to an issue board)
-
Plan (Board)
- Time to first commit
-
Code (IDE)
- Time to create a merge request
-
Test (CI)
- Time it takes GitLab CI/CD to test your code
-
Review (Merge Request/MR)
- Time spent on code review
-
Staging (Continuous Deployment)
- Time between merging and deploying to production
-
Production (Total)
- Total lifecycle time; i.e. the velocity of the project or team
How the data is measured
Cycle Analytics records cycle time and data based on the project issues with the exception of the staging and production stages, where only data deployed to production are measured.
Specifically, if your CI is not set up and you have not defined a production
or production/* environment, then you will not have any data for those stages.
Below you can see in more detail what the various stages of Cycle Analytics mean.
| Stage | Description |
|---|---|
| Issue | Measures the median time between creating an issue and taking action to solve it, by either labeling it or adding it to a milestone, whatever comes first. The label will be tracked only if it already has an Issue Board list created for it. |
| Plan | Measures the median time between the action you took for the previous stage, and pushing the first commit to the branch. The very first commit of the branch is the one that triggers the separation between Plan and Code, and at least one of the commits in the branch needs to contain the related issue number (e.g., #42). If none of the commits in the branch mention the related issue number, it is not considered to the measurement time of the stage. |
| Code | Measures the median time between pushing a first commit (previous stage) and creating a merge request (MR) related to that commit. The key to keep the process tracked is to include the issue closing pattern to the description of the merge request (for example, Closes #xxx, where xxx is the number of the issue related to this merge request). If the issue closing pattern is not present in the merge request description, the MR is not considered to the measurement time of the stage. |
| Test | Measures the median time to run the entire pipeline for that project. It's related to the time GitLab CI takes to run every job for the commits pushed to that merge request defined in the previous stage. It is basically the start->finish time for all pipelines. master is not excluded. It does not attempt to track time for any particular stages. |
| Review | Measures the median time taken to review the merge request, between its creation and until it's merged. |
| Staging | Measures the median time between merging the merge request until the very first deployment to production. It's tracked by the environment set to production or matching production/* (case-sensitive, Production won't work) in your GitLab CI configuration. If there isn't a production environment, this is not tracked. |
| Production | The sum of all time (medians) taken to run the entire process, from issue creation to deploying the code to production. |
Here's a little explanation of how this works behind the scenes:
- Issues and merge requests are grouped together in pairs, such that for each
<issue, merge request>pair, the merge request has the issue closing pattern for the corresponding issue. All other issues and merge requests are not considered. - Then the
<issue, merge request>pairs are filtered out by last XX days (specified by the UI - default is 90 days). So it prohibits these pairs from being considered. - For the remaining
<issue, merge request>pairs, we check the information that we need for the stages, like issue creation date, merge request merge time, etc.
To sum up, anything that doesn't follow the GitLab flow won't be tracked at all. So, the Cycle Analytics dashboard won't present any data:
- For merge requests that do not close an issue.
- For issues not labeled with a label present in the Issue Board.
- For issues not assigned a milestone.
- For staging and production stages, if the project has no
productionorproduction/*environment.
Example workflow
Below is a simple fictional workflow of a single cycle that happens in a single day passing through all seven stages. Note that if a stage does not have a start/stop mark, it is not measured and hence not calculated in the median time. It is assumed that milestones are created and CI for testing and setting environments is configured.
- Issue is created at 09:00 (start of Issue stage).
- Issue is added to a milestone at 11:00 (stop of Issue stage / start of Plan stage).
- Start working on the issue, create a branch locally and make one commit at 12:00.
- Make a second commit to the branch which mentions the issue number at 12.30 (stop of Plan stage / start of Code stage).
- Push branch and create a merge request that contains the issue closing pattern in its description at 14:00 (stop of Code stage / start of Test and Review stages).
- The CI starts running your scripts defined in
.gitlab-ci.ymland takes 5min (stop of Test stage). - Review merge request, ensure that everything is OK and merge the merge request at 19:00. (stop of Review stage / start of Staging stage).
- Now that the merge request is merged, a deployment to the
productionenvironment starts and finishes at 19:30 (stop of Staging stage). - The cycle completes and the sum of the median times of the previous stages is recorded to the Production stage. That is the time between creating an issue and deploying its relevant merge request to production.
From the above example you can conclude the time it took each stage to complete as long as their total time:
- Issue: 2h (11:00 - 09:00)
- Plan: 1h (12:00 - 11:00)
- Code: 2h (14:00 - 12:00)
- Test: 5min
- Review: 5h (19:00 - 14:00)
- Staging: 30min (19:30 - 19:00)
- Production: Since this stage measures the sum of median time off all previous stages, we cannot calculate it if we don't know the status of the stages before. In case this is the very first cycle that is run in the project, then the Production time is 10h 30min (19:30 - 09:00)
A few notes:
- In the above example we demonstrated that it doesn't matter if your first commit doesn't mention the issue number, you can do this later in any commit of the branch you are working on.
- You can see that the Test stage is not calculated to the overall time of the cycle since it is included in the Review process (every MR should be tested).
- The example above was just one cycle of the seven stages. Add multiple cycles, calculate their median time and the result is what the dashboard of Cycle Analytics is showing.
Permissions
The current permissions on the Cycle Analytics dashboard are:
- Public projects - anyone can access
- Internal projects - any authenticated user can access
- Private projects - any member Guest and above can access
You can read more about permissions in general.
More resources
Learn more about Cycle Analytics in the following resources: