The main aim of the project is to perform machine learning on the AURIX TC297 TFT board (TC29x B-Step MCU). Relying on the board features and its memory and computation constraints, a study has been done to understand which machine learning regression models could be adapted and run on the device.
The essential board components for this purpose are Ethernet, display, and multicore execution. The board communicates with a Python client installed in the host PC through the Ethernet connection, given its reliability and flexibility. The display is the simplest interface to give a quick view of the available data, without waiting for a download and post-processing of the results. The multicore execution is used to increase the computation performance.
Through the Ethernet connection it is possible to send data and receive the predictions from the models implemented within the board. Communication takes place through the classic TCP/IP protocol, where the board acts as a server and responds to connection requests from clients (which in the case study are installed in the Host PC, but can be installed on other boards as well). The scatter-plot of the predictions, which is typically used to show the results of regression models, is also plotted on the board screen during the data acquisition.
For further details you can read the following articles:
One of the main goals of the project is the execution of programs running on the three processor cores on the board. In the problem in hand, this feature can let us run machine learning predictions in parallel, thus speeding up the processing of a huge amount of data if needed. Moreover, this can let us parallelize the execution of some computational-intensive machine learning models and other activities. Thus, we implemented the producer/consumer pattern by using Core 0 to get data from outside, through the Ethernet connection, while Core 1 and Core 2 were employed to process them.
Core 0 deals with the acquisition of data from the Ethernet connection and the packaging within a data structure with some other scheduling information, such as the machine learning algorithm to apply and the client ID; this allows us to manage multi-client connections and multi-algorithm predictions. The new data structure is inserted into a common buffer, using appropriate enqueue and dequeue functions, and Core 1 and Core 2 are waked up. Another task of Core 0 is to collect the results of the computation and send them back to the client through the Ethernet connection.
Core 1 and Core 2 work in the same way, according to the function received by Core 0. If no data is ready in the common buffer, the two cores put themselves in idle mode and they are waked up again by Core 0 when new predictions are needed. Once awakened, each core consumes an element of the buffer and executes the prediction model, according to the values in the data structure. Upon completion of these operations, results are produced and saved into a second buffer for Core 0, which progressively sends them back to the client. Concurrently, results are also printed on the screen for a quick inspection.
Multi-core is also useful to manage multi-client connections. Since the board can accept multiple connections at a time, it is important to correctly manage the incoming data with the two cores and avoid conflicts. As mentioned above, a client ID is used to keep track of the different connections. In the following video, it is possible to see how two clients make a request of connection to the server and, after the connection is established, how data are sent to be processed.
The final aspect to be examined is concurrent execution. Due to the presence of the two common buffers, the first containing the data structures related to the external inputs and the second filled with the results, the access must be controlled to prevent multiple cores from accessing the same data at the same time. For this purpose, two locks are implemented, one for each buffer, taking care to release them correctly to avoid deadlocks.
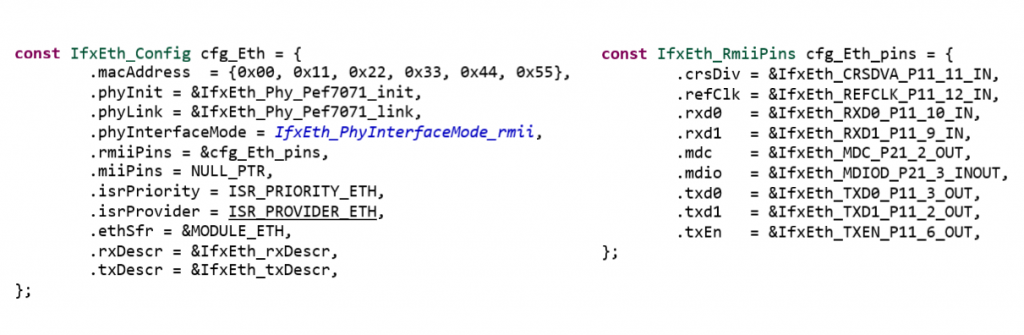
One of the main features needed for our project is intercommunication via Ethernet. This allows us to exchange data with a host PC or other devices and analyze them onboard. For our implementation, due to the limited memory resources available on the device, we decided to rely on lwIP (lightweight IP), an open-source TCP/IP stack designed for embedded systems. Its focus is to reduce resource usage while still having a full-scale TCP stack and it could be used in bare metal, without the necessity of an OS and directly relying on the data-link layer. So, it seemed to us the best choice.
Since there were neither recent nor working versions for our board, we decided to port it from scratch, counting on IFX libraries for the lower network layers and choosing as target version the last lwIP stable one, the 2.1.2 released at the end of the 2018. In order to achieve this goal, the main aspect to consider is the writing of the configuration. The first major problem to solve was dealing with the pinout configuration: even though in debug mode the board seemed to work correctly, in standalone mode the Ethernet port initialization caused crashes.
Thanks to the lwIP porting, we can have full access to UDP and TCP API, both with application and raw connections, and other functionalities such as DNS and the more important DHCP support, in order to simply use the Infineon TC297 without bothering configurations on the device itself or on an external router.
Regarding the connection with other devices, we decided to start with the default TCP Echo library and edit it according to our needs. The board works as a server, accepting data both from local and remote networks, while the clients themselves only need to packet information in a predefined structure with a certain behavior. In our implementation, one core is dedicated to the ethernet intercommunication, while the other two’s scope is the bare elaboration and visualization on the display, thanks to the GLCD and ML libraries. The data exchange and elaboration process can be divided in three different phases.
Each client starts the communication by sending its own autogenerated ID, which identifies itself, and the size of raw data that should be elaborated.
If the server is able to allocate the needed space, the data exchange begins and all results are bound to that specific client. In this way, a bunch of samples for the machine learning predictions is sent to the board and all data are elaborated in parallel, thanks to the multicore library. Moreover, thanks to the latter together with the client IDs, we can afford multiple client connections and visualized machine learning results on the screen using different colors, one corresponding to each client ID.
Finally, when all instances results are elaborated, these are sent back to the client, that can decide to instantiate a new “connection slot” and proceed with other data or simply close the connection with the server.
An example of a remote client located in Lecce, while the board is elaborating data in Turin.
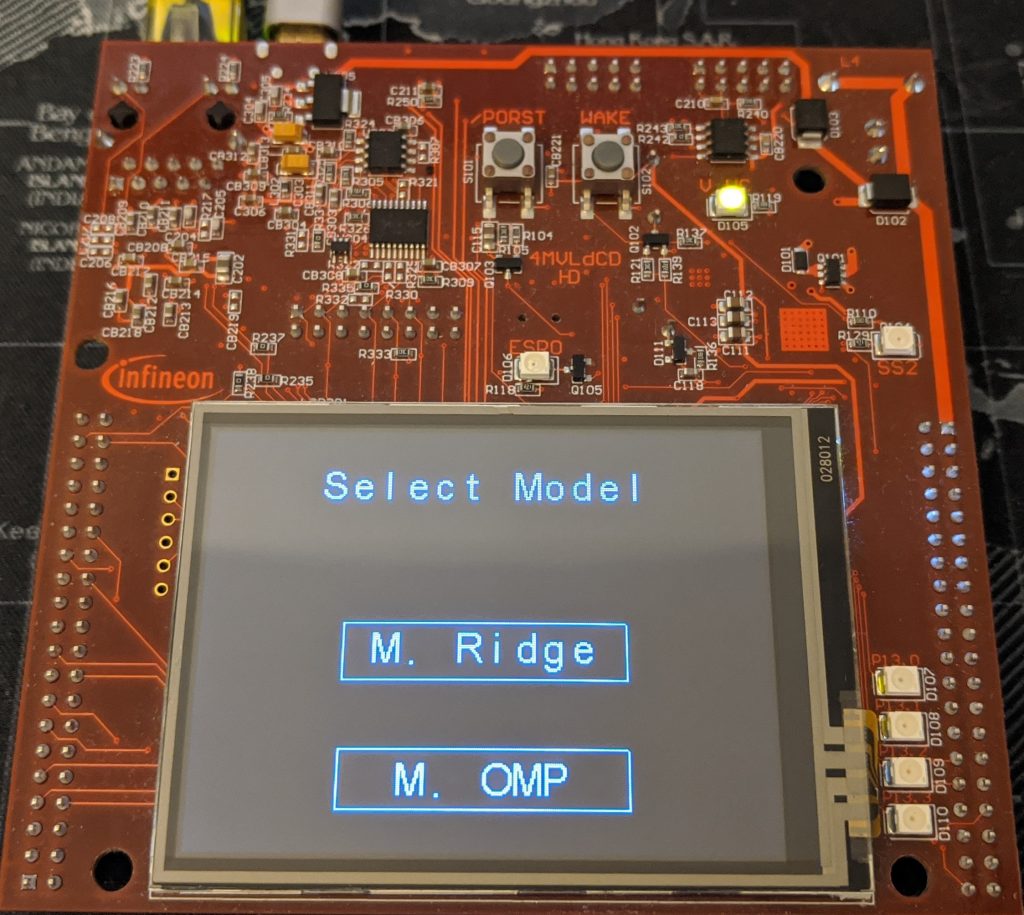
Among the various possibilities offered by the Infineon Aurix TFT 297 board, the presence of a touch screen display (320×240 xga LCD) immediately outlined one of the main objectives of the project. In fact, the screen is the simplest interface to give a quick view of the available data, and the touch screen provides the possibility of receiving quick inputs for any operations on the board.
When the board starts, the initial screen is displayed, and all the implemented algorithms are shown. At this point, the board waits for an external input, via touch screen, and all the other functions are temporarily disabled. When one of the available models is selected, all the other operations are restarted, and the empty chart is displayed on the screen.
It’s useful at this point to discuss the choices made to display the data. Given the initial decision to implement algorithms for regression, it was decided to represent the data through a scatter plot. The latter provides a quick tool to understand the quality of the prediction performed. A concentration of points close to the diagonal will represent better performance.
After the initial setup, raw values are sent by the client. At this point they are processed and, as soon as the prediction result is available, a function is called to draw the point. The latter scales the values and uses a low-level function to turn on a single pixel on the screen. For each connection, a different color is assigned, in order to provide more readability.
A final analysis of the internal storing of the result was made, in order to add some functionalities to the screen. Considering 4 Byte for the predicted value and the same for the measured one, a total of 8 Byte is needed for each instance. Since the dataset used for test contains ~5000 records, a total of 40kB for each client seemed too much. For this reason, in the implementation, all values are thrown away as soon as they are displayed.
The machine learning section of the project had the goal of transpile the regressor model trained in Python and bring it in C-code, to run inference on the board. The starting point was a regression model generated using scikit-learn (or sklearn), with few steps of pre-processing and training.
Sklearn groups together the steps of the overall model in the so-called Pipeline. So the first thing to do is to split the Pipeline into separate steps and to generate intermediate data. Then the question was “How could I bring this Python code in C?”.
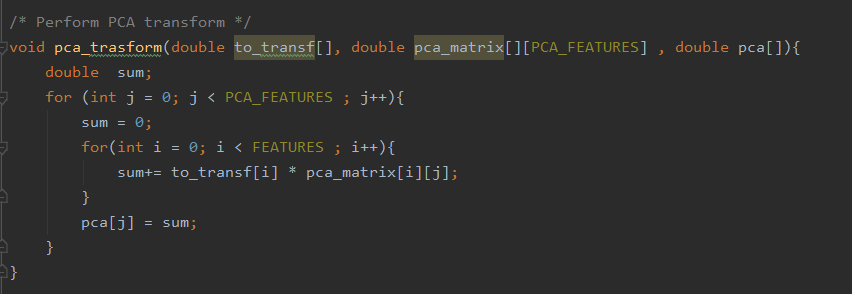
I started studying the preprocessing steps from a mathematical point of view, extracting the mean and standard deviation of features to normalize each data with a StandardScaler and then I performed a Principal Component Analysis (PCA). I didn’t know exactly how the PCA algorithm could bring the data from one to another representation space, but I knew that PCA is a linear combination of features, so it had to exist a transformation matrix that, when multiplied to the original vector of data, could extract the principal components. I was able to find the entries of this matrix into the attributes of the PCA, so in C the transformation became a matrix multiplication. I transformed once again the principal components in polynomial features, for better performance.
Then the challenge was to take the regressor model in Python and bring it to C.
A regressor is something like a function y=f(x) that receives as input the multi-dimensional data x to analyze and then performs a prediction, generating a real scalar value y. If the model is linear, in C this could be implemented as a linear combination of each feature plus a constant value. The coefficients associated with every term and the intercept value are the attributes of the linear model, so we can extract them and build a C function that makes the dot product of coefficients and features and adds the intercept. I used a Python third-party library, M2Cgen, that made this for me.
Thanks to these steps I was able to run inference in C, without C-third-party libraries or expensive operations, just addition and multiplication.
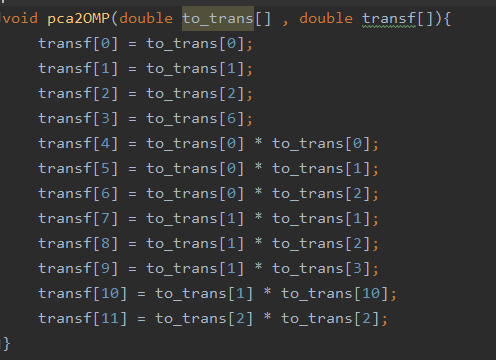
The model I transpiled to C received as input a vector of 120 components: in some situations, this could be too expensive in terms of memory usage and becomes unacceptable when we have to store a large amount of data before sending them to a client. So I thought: “How could I reduce the memory usage and computational effort?”. I have tried different types of models and I found that an SGD-Regressor didn’t use 44 of the 120 input, choosing zero-coefficients for them, so these features could be simply not stored in memory. But my researches does not stop: I trained an Orthogonal Matching Pursuit model, finding that it uses just 10% of the features (so 12/120), with absolutely comparable performance. A great saving of memory and computation!
After bringing the model in C, the problem was: “How the data should arrive from a client to the board?”. I wrote a simple Python script that serializes the raw-data vector and sends it to a socket, using TCP protocol. The data were delivered in a fast and reliable way. I was able to make a C-program and a Python-script communicate, to start inference of a regression model in C, but now this should bring to the board.
I sent all of this code to my teammates, that dealt with the TCP-IP stack implementation and integrated onboard these developed features.